You can use these steps to display multiple plots in a single window.
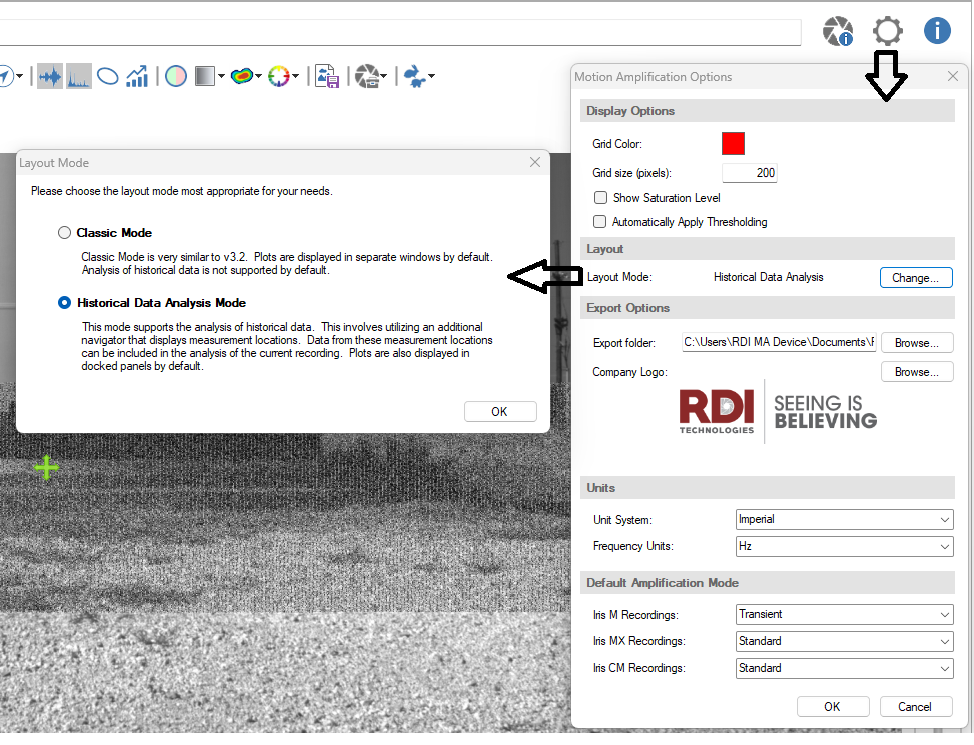
1) Make sure you're in "Historical Data Analysis" mode from Motion Amplification Settings
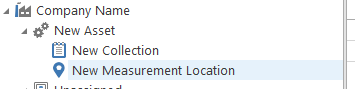
2) Create a "Collection"
3) Create a Measurement Location under the Asset. Select the Asset level Icon and either Right-click to reveal a pop-up menu or use the top ribbon toolbar and select "New Measurement Location".
4) Move the recordings you want to "historize" into the Collection
5) From the appropriate window - Spectrum or Waveform - right-click and select "Attach Waveform to>Current Collection (Measurement Location)".

6) Once you have all the items added to the Collection/Measurement Location, you'll be able to select and add them to Waterfall Plots by using the "Navigation" pane.

You'll see this message the first time you open the Navigation Panel and it gives a "very brief" explanation.

When you have a recording open and you click on the "Waterfall" icon, highlighted with the green box below,
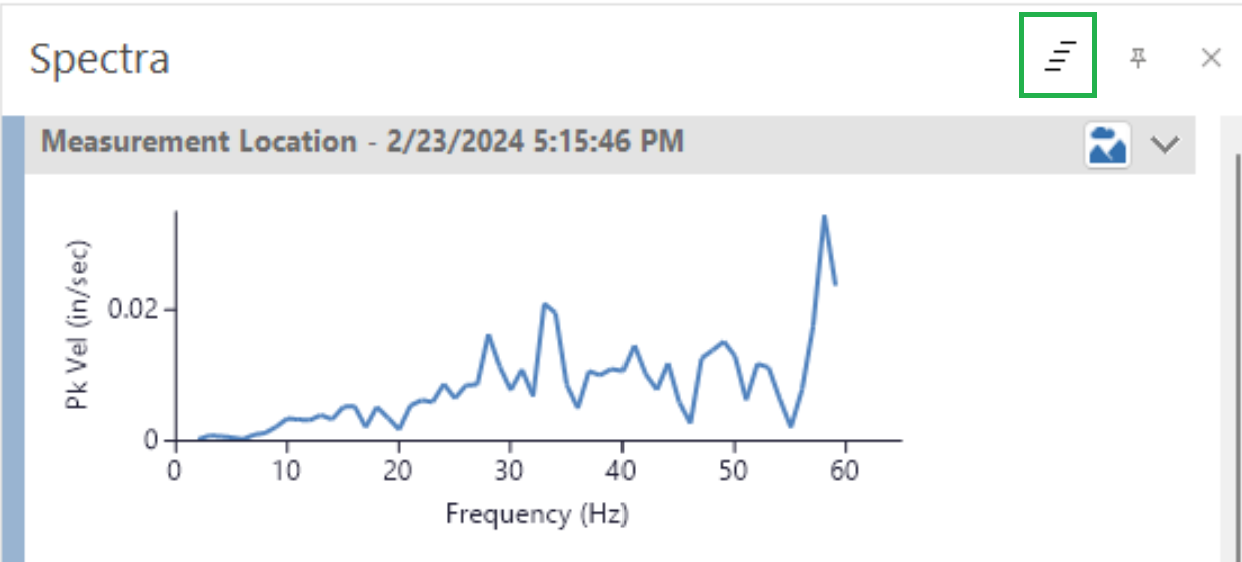
you'll get a Waterfall that includes ALL of the plots you have "checked" from the Navigation pane.

Related Articles:
How do I use the Camera Overlay Mode?